


# The Ultimate Guide to Supply Chain BI: 5 Steps to Unlock Data-Driven Decisions
Imagine knowing exactly which supplier will be late next week, which warehouse is underutilized, or which product line is about to face a shortage. This is not a fantasy. It is the power of supply chain business intelligence, or supply chain BI. In a world of constant disruption, gut feeling is no longer enough. Companies that leverage data are the ones that survive and thrive. This guide will explain what supply chain BI truly is, why it is a game-changer, and provide a clear, actionable roadmap for implementing it successfully.
At its core, supply chain BI is the process of collecting, analyzing, and visualizing data from across your entire supply chain network. This includes data from procurement, manufacturing, inventory, logistics, and sales. The goal is to transform raw, siloed data into clear, actionable insights that drive smarter, faster decisions. Unlike traditional reporting that tells you what happened yesterday, modern supply chain BI platforms use dashboards and analytics to predict what will happen tomorrow.
The business case is overwhelming. According to a McKinsey report, companies that aggressively use data and analytics across their supply chain can boost their earnings before interest and taxes by over 60 percent. Furthermore, a study by the MIT Center for Transportation & Logistics found that data-driven supply chains are 50 percent more effective at avoiding disruptions. The question is no longer if you need supply chain BI, but how to get it right.
# Understanding the Core Components of Supply Chain BI
A robust supply chain BI system is built on several key pillars. First, you need data integration. This is the foundational step of pulling information from all your disparate systems—ERP, warehouse management, transportation management, supplier portals, and IoT sensors. Without integration, you are only seeing fragments of the picture.
Next comes data warehousing and management. The integrated data needs a central, clean, and organized home—a data warehouse or lake. Here, data is standardized and prepared for analysis. The third pillar is analytics and visualization. This is where the magic happens. Tools create interactive dashboards showing key performance indicators like perfect order rate, inventory turnover, cash-to-cash cycle time, and on-time in-full delivery.
Finally, there is predictive and prescriptive analytics. The most advanced systems do not just report on the past; they use statistical models and machine learning to forecast future demand, predict potential delays, and even recommend optimal actions. For instance, the system might presuggest rerouting a shipment or increasing safety stock for a specific component.
# The Tangible Benefits You Cannot Ignore
Implementing supply chain BI delivers concrete advantages across the board. The most immediate impact is often on cost reduction. By identifying inefficiencies in transportation routes, minimizing excess inventory, and optimizing warehouse space, companies can save millions. Visibility improves dramatically, giving you a real-time, end-to-end view of your operations from supplier to customer.
This enhanced visibility directly boosts resilience. You can proactively identify risks, such as a port congestion or a supplier quality issue, and mitigate them before they cause a crisis. Customer satisfaction also soars. With better demand forecasting and inventory management, you can ensure products are available when and where customers want them, leading to higher on-time delivery rates.
From my experience consulting with manufacturing firms, the shift is profound. One team we worked with moved from weekly spreadsheet reports to a live dashboard. Suddenly, the logistics manager and the sales director were looking at the same data in real-time. Arguments about blame for stockouts vanished, replaced by collaborative problem-solving focused on the root cause. That cultural shift towards data-driven dialogue is an underrated but critical benefit.
# A Practical Comparison: BI Tools and Platforms
Choosing the right tool is crucial. The market offers everything from broad enterprise platforms to specialized supply chain solutions. The table below compares two common approaches.
| Feature / Aspect | General-Purpose BI Platform (e.g., Power BI, Tableau) | Specialized Supply Chain Analytics Suite |
|---|---|---|
| Primary Strength | Extreme flexibility and customization; excellent for company-wide reporting. | Deep, pre-built supply chain logic, KPIs, and data models out-of-the-box. |
| Implementation Speed | Slower; requires significant effort to build supply-chain-specific data models and dashboards from scratch. | Faster; comes with pre-configured connectors to common SCM systems and template dashboards. |
| Required Expertise | High in both BI tool mastery and deep supply chain domain knowledge to build correctly. | Lower initial BI skill requirement; relies more on vendor expertise embedded in the software. |
| Best For | Organizations with strong in-house BI teams that need a unified tool for all departments. | Supply chain teams that need rapid time-to-value and deep domain functionality without heavy customization. |
# Your 5-Step Roadmap to Implementing Supply Chain BI
WARNING: A COMMON MISTAKE
Do not start by buying a software license. The biggest failure point in supply chain BI projects is diving into tools before aligning on business goals and data quality. You will end up with a shiny dashboard displaying garbage data, leading to distrust and abandonment. Always follow a phased, goal-oriented approach.
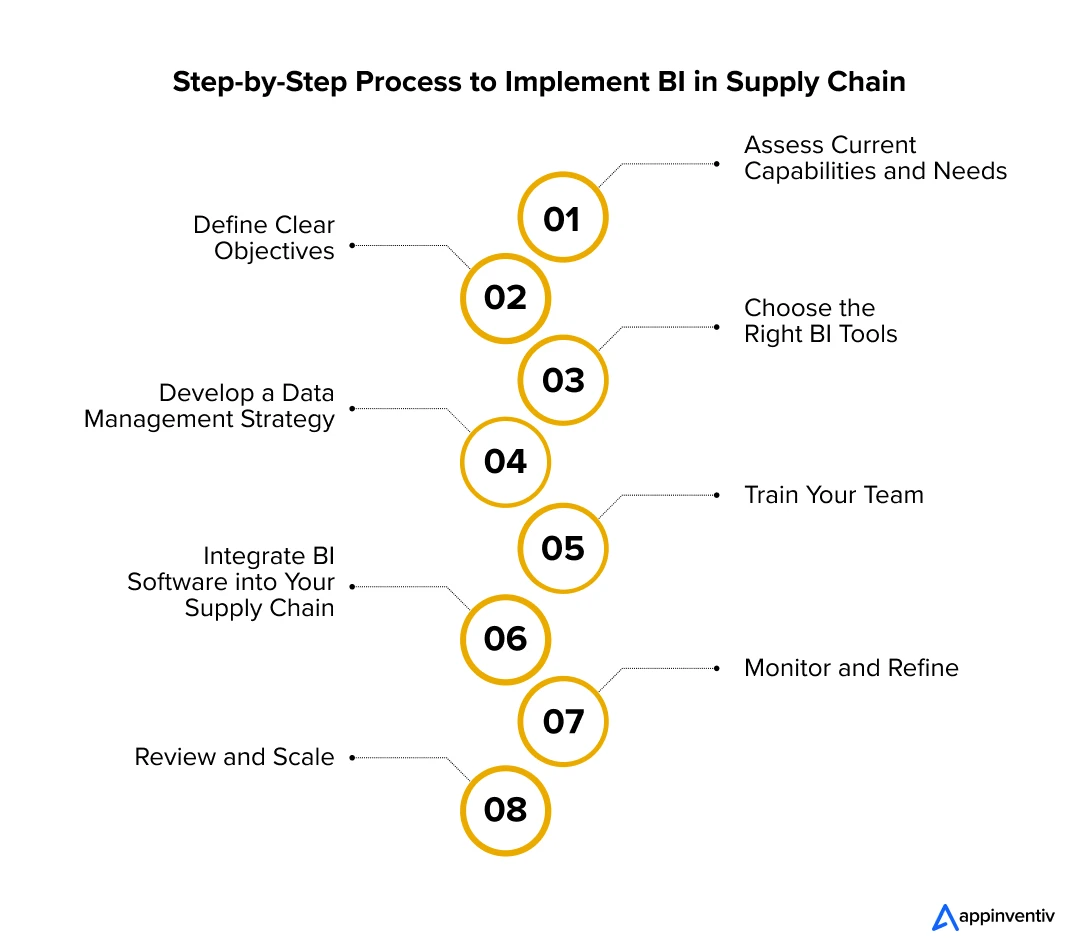
Here is a proven, step-by-step guide to ensure your supply chain BI initiative delivers real value.
STEP 1: DEFINE CRITICAL BUSINESS QUESTIONS.
Begin with the end in mind. Gather stakeholders from planning, procurement, logistics, and sales. Ask: What are our top 3 pain points? What decisions do we struggle to make? Frame these as questions. For example: “Which suppliers have the highest risk of causing production delays?” or “What is our optimal inventory level for flagship products to maximize service level at minimal cost?” These questions become your project’s north star.
STEP 2: AUDIT AND INTEGRATE YOUR DATA SOURCES.
Map out where the data to answer your questions lives. You will likely need data from ERP, WMS, TMS, and spreadsheets. Assess the quality and consistency of this data. This phase often involves data cleansing—fixing missing values, standardizing units, and aligning part numbers. The goal is to create a single, trusted source of truth.
STEP 3: SELECT AND DESIGN KEY PERFORMANCE INDICATORS.
Based on your business questions, design the KPIs that will measure success. Move beyond basic metrics. Instead of just “Inventory Value,” track “Days of Supply” by product category. Instead of “On-Time Shipments,” measure “On-Time In-Full” to the customer’s original request. Design how these KPIs will be visualized on a dashboard for clarity and quick interpretation.
STEP 4: DEVELOP AND DEPLOY PILOT DASHBOARDS.
Start small. Choose one critical business question and build a single, focused dashboard to answer it. For instance, create a supplier performance dashboard. Deploy it to a small pilot group of power users. Gather their feedback on data accuracy, usability, and actionability. Iterate and improve based on this real-world use. This agile approach minimizes risk and builds confidence.
STEP 5: SCALE, TRAIN, AND EMBED INTO CULTURE.
Once the pilot is successful, scale the solution to other areas of the supply chain. Develop a formal training program to ensure all users understand how to read the dashboards and what actions to take. Crucially, leadership must mandate the use of data in meetings and decision-making processes. This embeds the BI system into the daily operational culture, turning it from a tool into a mindset.
# The Future is Predictive and Connected
The evolution of supply chain BI is moving towards autonomous decision-making. We are seeing the rise of AI-driven predictive analytics that can forecast disruptions with startling accuracy. Furthermore, the integration of external data—weather patterns, geopolitical events, social media sentiment—is creating “outside-in” supply chain intelligence. The next frontier is the connected ecosystem, where BI platforms seamlessly share insights with key suppliers and logistics partners, creating a collaborative, transparent, and immensely resilient network.
The journey to a data-driven supply chain is iterative. It requires patience, cross-functional collaboration, and a focus on business outcomes over technological bells and whistles. By following the structured approach outlined here, you can cut through the hype and build a capability that delivers lasting competitive advantage.
YOUR SUPPLY CHAIN BI IMPLEMENTATION CHECKLIST
– Identify and document three to five critical business questions from stakeholders.
– Secure executive sponsorship and define clear project ownership.
– Conduct a thorough data source audit and quality assessment.
– Cleanse and standardize core data sets before any tool implementation.
– Select KPIs that are actionable, not just observational.
– Start with a focused pilot dashboard for a single use case.
– Establish a feedback loop with pilot users for rapid improvements.
– Develop a company-wide training and change management plan.
– Define a process for regular dashboard and KPI review meetings.
– Plan for ongoing maintenance, data governance, and future scaling.


