# The Ultimate Guide to Panama City Rainfall Totals: Data, Trends, and Expert Insights
Understanding Panama City rainfall totals is crucial for residents, travelers, and businesses alike. This tropical destination has a distinct wet and dry season, and knowing the precipitation patterns can help you plan the perfect trip, manage water resources, or prepare for seasonal weather. This guide provides a deep dive into Panama City’s rainfall data, historical trends, and practical advice based on authoritative sources.
We will explore where to find accurate rainfall data, what the monthly averages really mean, and how climate patterns like El Nino influence the totals. You will also learn how to interpret this data for real-world applications. Let us begin by examining the core climate characteristics that define rainfall in Panama City.
## Panama City’s Tropical Climate Explained
Panama City enjoys a tropical savanna climate. This classification means the city experiences a pronounced dry season and a heavy wet season, rather than consistent rainfall year-round. The key driver is the movement of the Inter-Tropical Convergence Zone, a belt of low pressure that brings moist air and precipitation as it shifts north and south with the sun.
Temperatures remain relatively constant throughout the year, averaging between 75degF and 90degF. The real variable is precipitation. The dry season, known locally as “verano” or summer, typically runs from mid-December to April. The wet season, “invierno” or winter, spans from May to mid-December, with a noticeable peak in rainfall intensity.
## Monthly and Annual Rainfall Averages
Panama City rainfall totals vary dramatically from month to month. Relying on long-term averages gives the most reliable picture. According to data from the World Meteorological Organization and Panama’s ETESA hydrometeorological institute, the city receives an average annual rainfall of approximately 1,900 millimeters, which is about 75 inches.
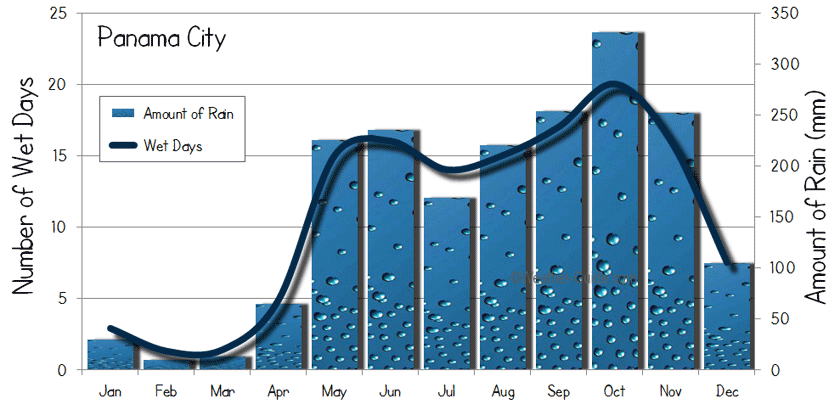
Here is a typical breakdown of monthly precipitation in Panama City:
– January: Very low, often under 30 mm
– February: Extremely low, sometimes less than 10 mm
– March: Low, around 15 mm
– April: Begins to increase, around 65 mm
– May: Start of wet season, sharp rise to about 210 mm
– June: High, around 235 mm
– July: Often a brief drier period (“veranillo”), around 180 mm
– August: High, around 220 mm
– September: Peak of wet season, around 250 mm
– October: Very high, similar to September
– November: High, begins to decrease, around 240 mm
– December: Transition to dry season, drops to about 130 mm
These figures are averages, and actual Panama City rainfall totals can be significantly higher or lower in any given year due to larger climate phenomena.
## Where to Find Accurate and Current Rainfall Data
For the most reliable information, you need to consult official and scientific sources. Relying on anecdotal reports or outdated blogs can lead to poor planning. Here are the primary sources we recommend:
OFFICIAL GOVERNMENT SOURCES: Panama’s national utility company, ETESA, operates the Hydrometeorology Branch (Empresa de Transmision Electrica S.A.). Their website provides historical data, monthly reports, and sometimes real-time rainfall maps for various stations, including those in the Panama City metropolitan area.
INTERNATIONAL CLIMATE DATABASES: Organizations like the World Bank Climate Change Knowledge Portal and NOAA’s National Climatic Data Center archive historical climate data for Panama City. These are excellent for research and long-term trend analysis.
WEATHER FORECASTING SERVICES: While focused on forecasts, platforms like Weather.com or AccuWeather often provide historical average charts for specific locations, which are useful for quick reference.
In our team’s experience analyzing climate data for Central American projects, we have found that cross-referencing ETESA data with international databases provides the most robust and accurate picture. Local data is essential for granularity, while global databases help contextualize Panama City’s climate within larger regional patterns.
## The Impact of El Nino and La Nina on Rainfall
Panama City rainfall totals are heavily influenced by the El Nino-Southern Oscillation cycle. This climate pattern in the Pacific Ocean has a direct and significant impact on weather across Central America.
During an El Nino event, Panama City and much of the region typically experience drier than average conditions. The dry season may be more severe, and the wet season may be shorter or less intense. This can lead to water shortages and increased wildfire risk.
Conversely, a La Nina event usually brings wetter than average conditions to Panama. The wet season can be longer and more intense, with higher monthly rainfall totals, increasing the risk of flooding and landslides in vulnerable areas.
Monitoring forecasts from the Climate Prediction Center can give you an early indication of whether an upcoming season is likely to be anomalously wet or dry.
## How to Use Rainfall Data for Trip Planning
If you are planning a visit, understanding Panama City precipitation data is the key to packing correctly and setting expectations. The “best” time to visit depends entirely on your priorities.
THE DRY SEASON (Dec-Apr): This is peak tourist season for a reason. You can expect abundant sunshine, minimal rain, and low humidity. It is ideal for beach days, city tours, and outdoor activities. However, this also means higher prices for flights and hotels, and more crowded attractions.
THE WET SEASON (May-Nov): This period offers a different experience. Rainfall usually comes in intense but short afternoon showers, with mornings often clear. The landscape is lush and green, prices are lower, and there are fewer tourists. The exception is the peak months of October and November, which can see prolonged rainy periods.
A common mistake is to avoid Panama City entirely during the wet season. For many travelers, especially those comfortable with sporadic rain, the wet season offers fantastic value and vibrant scenery. The key is to plan your days around the typical pattern: major outdoor activities in the morning, with a flexible plan for the afternoon.
## Comparing Rainfall: Panama City vs. Other Tropical Destinations
To put Panama City rainfall totals into perspective, it is helpful to compare them with other popular tropical locations. The following table illustrates key differences in annual precipitation and seasonality.
| City / Destination | Annual Rainfall Average | Distinct Dry Season? | Peak Wet Months |
|---|---|---|---|
| Panama City, Panama | ~1,900 mm (75 in) | YES, Strong (Dec-Apr) | Sep-Oct-Nov |
| San Jose, Costa Rica | ~1,800 mm (71 in) | YES, Moderate (Dec-Apr) | May-Jun, Sep-Oct |
| Miami, USA | ~1,600 mm (63 in) | YES, Moderate (Nov-Apr) | Jun-Sep |
| Singapore | ~2,300 mm (91 in) | NO, Rain year-round | Nov-Jan (Northeast Monsoon) |
As the table shows, Panama City has a higher annual total than Miami but a much more concentrated wet season. Compared to Singapore, Panama City’s climate offers a reliable, sun-drenched dry season, which is a major advantage for seasonal planning.
## A Step-by-Step Guide to Analyzing Local Rainfall Data
Whether you are a researcher, a farmer, or a developer, you may need to go beyond averages. Here is a practical guide to conducting a basic analysis of Panama City rainfall data.
STEP 1: Identify Your Data Source. Bookmark the ETESA hydrometeorology page and a reputable international database like the World Bank’s portal.
STEP 2: Define Your Timeframe. Are you looking at a specific month, a season, or a multi-year trend? Your timeframe will dictate which dataset you need.
STEP 3: Gather the Raw Data. Download or note the monthly rainfall figures for your chosen period. For trends, gather data for at least the last 10-20 years.
STEP 4: Calculate Key Metrics. Compute the average for your period. If analyzing trends, calculate the year-to-year change or a running average to smooth out variability.
STEP 5: Contextualize the Numbers. Compare your findings to the long-term average. Check the historical record for El Nino or La Nina years during your study period to see if they correlate with anomalies in your data.
STEP 6: Apply Your Findings. Use your analysis to make an informed decision, whether it is about crop planting schedules, construction timelines, or water conservation measures.
WARNING: COMMON MISINTERPRETATIONS OF RAINFALL DATA
A major pitfall is taking a single month’s or year’s data as the new normal. Panama City rainfall totals are inherently variable. One very wet October does not mean every October will be that wet. Always base major decisions on long-term averages and probabilistic forecasts, not on the most recent or most extreme event. Another mistake is ignoring microclimates. Rainfall can vary significantly between neighborhoods in Panama City, especially between the coastal areas and the slightly higher inland suburbs.
## The Future of Rainfall in Panama City: Climate Change Considerations
Climate models suggest that Panama, like much of the tropics, may experience changes in precipitation patterns. While the total annual Panama City rainfall may not change drastically, the distribution and intensity likely will. The dry season could become drier, and the wet season could see more intense, heavy downpours separated by longer dry spells. This increases the risk of both drought and flash flooding.
A 2021 report from the World Bank Group on climate and development in Panama notes that changing rainfall patterns pose a significant challenge to water security and infrastructure (source: World Bank Group Climate and Development Report for Panama). Adapting to this requires updated data, resilient urban planning, and sustainable water management practices.
## Your Practical Checklist for Using Panama City Rainfall Information
To make the most of this guide, use this actionable checklist. It consolidates the key takeaways for quick reference.
– CONFIRM the current season (Dry: Dec-Apr, Wet: May-Nov) before finalizing plans.
– CHECK the forecast for El Nino or La Nina status to anticipate a drier or wetter season.
– PRIORITIZE morning hours for critical outdoor activities during the wet season.
– CONSULT official ETESA data for historical averages and serious planning.
– PACK accordingly: sunscreen and hats for the dry season, a compact rain jacket and quick-dry clothing for the wet season.
– CONSIDER the wet season for travel to enjoy lower prices and lush landscapes.
– ANALYZE long-term data, not single data points, for any project or business decision.
– STAY informed about local weather alerts during the peak rainy months for safety.
By understanding Panama City rainfall totals in depth, you move from guessing to informed planning. This knowledge empowers you to choose the best time for your visit, manage resources effectively, and appreciate the dynamic climate of this vibrant tropical city.