


Understanding the Indian GDP growth rate is crucial for investors, policymakers, and anyone with a stake in the global economy. This comprehensive guide breaks down the latest trends, historical context, and future forecasts. We will explore what drives this key economic indicator and what it means for you.
# What is the Indian GDP Growth Rate and Why Does It Matter
The Indian GDP growth rate measures the annual percentage change in the country’s gross domestic product. It is the broadest gauge of economic health. A rising rate signals expansion, job creation, and higher incomes. A declining rate can indicate slowdowns or recessions. For a nation of India’s size and ambition, this number is more than a statistic. It is a report card on development and a signal to global markets.
# Key Drivers of India’s Economic Expansion
Several interconnected factors power India’s economic engine. Domestic consumption is the primary driver, fueled by a young and growing population. Government spending on infrastructure creates jobs and boosts productivity. Private investment, both domestic and foreign, is critical for long-term capacity building. Finally, exports and services, especially in the technology sector, contribute significantly to foreign exchange earnings.
Interestingly, the contribution of these drivers shifts over time. For instance, during global downturns, domestic demand often cushions the blow. According to the Ministry of Statistics and Programme Implementation, private final consumption expenditure accounted for nearly 58% of India’s GDP in the fiscal year 2022-23, underscoring its dominant role.
# Historical Trends and Recent Performance
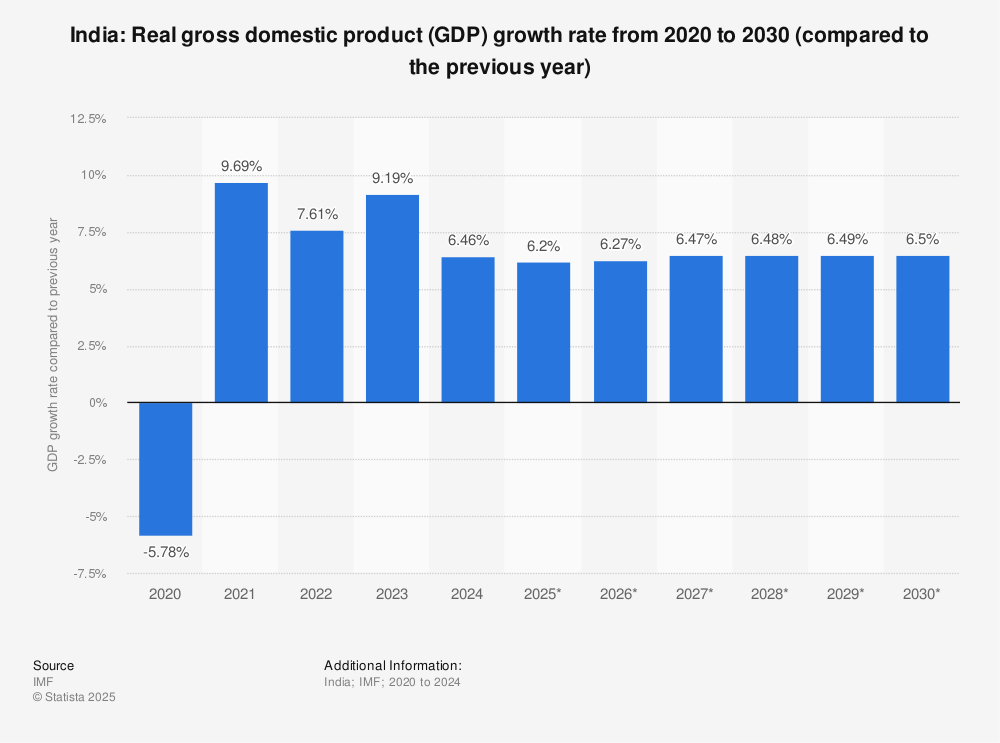
India’s economic journey has seen remarkable phases. After liberalization in 1991, growth accelerated. The period from 2003 to 2010 saw an average annual GDP growth rate exceeding 7%, peaking at over 8% in some years. The 2020 pandemic caused a sharp contraction, but a strong rebound followed.
Recent quarters have shown resilience. The Indian economy grew by 8.2% in the fiscal year 2023-24, as per provisional estimates from the National Statistical Office. This robust performance was supported by strong growth in manufacturing and construction sectors. However, economists watch for signs of sustainability amid global headwinds.
# Comparing India’s Growth with Other Major Economies
To put the Indian GDP growth figure in perspective, it is helpful to compare it with other large economies. This comparison highlights relative momentum and shifting global economic power.
| Economy | 2023 GDP Growth Rate (Estimate) | Primary Growth Driver | Key Challenge |
|---|---|---|---|
| India | 7.2% | Domestic Consumption & Investment | Job Creation for Youth, Inflation |
| China | 5.2% | Government-led Investment, Exports | Demographic Aging, Property Sector |
| United States | 2.5% | Consumer Spending, Technology | High Interest Rates, Debt |
| European Union | 0.5% | Services Exports | Geopolitical Energy Shock |
As the table shows, India consistently posts a higher GDP growth rate than mature economies. This gap represents both an opportunity and a challenge. The opportunity lies in rapid development. The challenge is to manage this growth inclusively and sustainably.
# A 5-Step Framework to Analyze Future GDP Growth Rate Reports
When a new quarterly or annual Indian GDP growth figure is released, follow this structured approach to move beyond the headline number.
STEP 1: CHECK THE BASE EFFECT. Determine if the current growth percentage is influenced by an unusually low or high base from the previous year. This can distort the true trend.
STEP 2: DECONSTRUCT BY SECTOR. Look at the growth in agriculture, industry, and services. Which sector is leading or lagging? Strong industrial growth often signals broad-based health.
STEP 3: EXAMINE THE DEMAND SIDE. Analyze data on private consumption, government spending, investment, and net exports. Is growth driven by investment or consumption?
STEP 4: CROSS-VERIFY WITH HIGH-FREQUENCY INDICATORS. Correlate the GDP data with other metrics like GST collections, PMI surveys, and auto sales. Do they tell a consistent story?
STEP 5: ASSESS POLICY RESPONSE. Consider how the Reserve Bank of India and the government might react. Will the data prompt interest rate changes or new fiscal measures?
Following these steps will give you a nuanced, professional understanding of each new data release.
# Common Pitfalls and Misconceptions About GDP Growth
WARNING: AVOID THESE COMMON MISTAKES WHEN INTERPRETING GROWTH DATA.
A high Indian GDP growth rate does not automatically mean widespread prosperity. The benefits of growth can be unevenly distributed across regions and social groups. Another major pitfall is ignoring per capita GDP. With a large population, India’s per capita income remains lower than many slower-growing economies. Furthermore, GDP growth does not account for environmental degradation or resource depletion. A nation can show strong numbers while harming its long-term ecological health. Finally, quarterly volatility is normal. Do not extrapolate a single quarter’s high or low figure into a long-term trend without deeper analysis.
# The Road Ahead: Forecasts and Strategic Implications
Most international agencies project India to remain the fastest-growing major economy in the coming years. The International Monetary Fund, in its April 2024 World Economic Outlook, forecast a growth rate of 6.8% for India in 2024. This optimism is based on continued digitalization, infrastructure spending, and a demographic dividend.
However, risks persist. Global slowdowns can hurt exports and investment. Geopolitical tensions may disrupt supply chains. Domestically, managing inflation while supporting growth is a delicate balancing act for policymakers. From my experience analyzing emerging markets, India’s key task is to translate high GDP growth into productive, formal-sector employment. Growth that creates quality jobs is far more valuable and sustainable.
# Your Actionable Checklist for Tracking India’s Economic Growth
To effectively monitor and understand the Indian GDP growth narrative, use this practical checklist.
MONITOR OFFICIAL RELEASES: Bookmark the Ministry of Statistics and Programme Implementation website for official data.
FOLLOW LEADING INDICATORS: Track the Purchasing Managers’ Index for manufacturing and services monthly.
ANALYZE SECTORAL PERFORMANCE: Pay special attention to capital goods production and credit growth.
WATCH POLICY ANNOUNCEMENTS: Note statements from the Reserve Bank of India and the Finance Ministry.
CONSIDER GLOBAL CONTEXT: Keep an eye on oil prices, foreign institutional investor flows, and major trade partner economies.
REVIEW LONG-TERM TRENDS: Look at five-year and ten-year growth averages, not just yearly changes.
This disciplined approach will help you cut through the noise and build a coherent picture of India’s economic trajectory.


