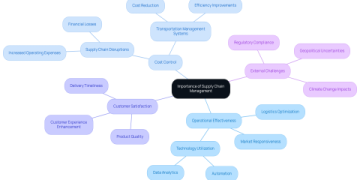


# In What Ways Does Accurate Mapping Influence Supply Chain Efficiency? 7 Critical Impacts Explained
Imagine a global supply chain as a living organism. Its veins and arteries are the routes connecting suppliers, factories, and customers. Now, imagine navigating this complex system with an outdated, blurry map. The result? Delays, waste, and immense frustration. This is the stark reality for businesses operating without accurate mapping. The question is not just about maps, but about creating a dynamic, intelligent digital twin of your entire logistics network. So, in what ways does accurate mapping influence supply chain efficiency? The impacts are profound and multi-layered, transforming guesswork into precision.
At its core, accurate mapping goes far beyond simple road networks. It integrates geospatial data, real-time traffic, facility layouts, warehouse slotting, and even geopolitical risk zones. This holistic view enables what experts call “spatial intelligence.” According to a report by McKinsey & Company, companies that leverage advanced analytics, including geospatial data, can improve supply chain efficiency by up to 30% and reduce costs by 10-15%. This is not a marginal gain. It is a fundamental competitive advantage.
Let us break down the seven most critical ways accurate mapping drives this efficiency.
## 1. Optimizing Transportation Routes and Reducing Fuel Costs
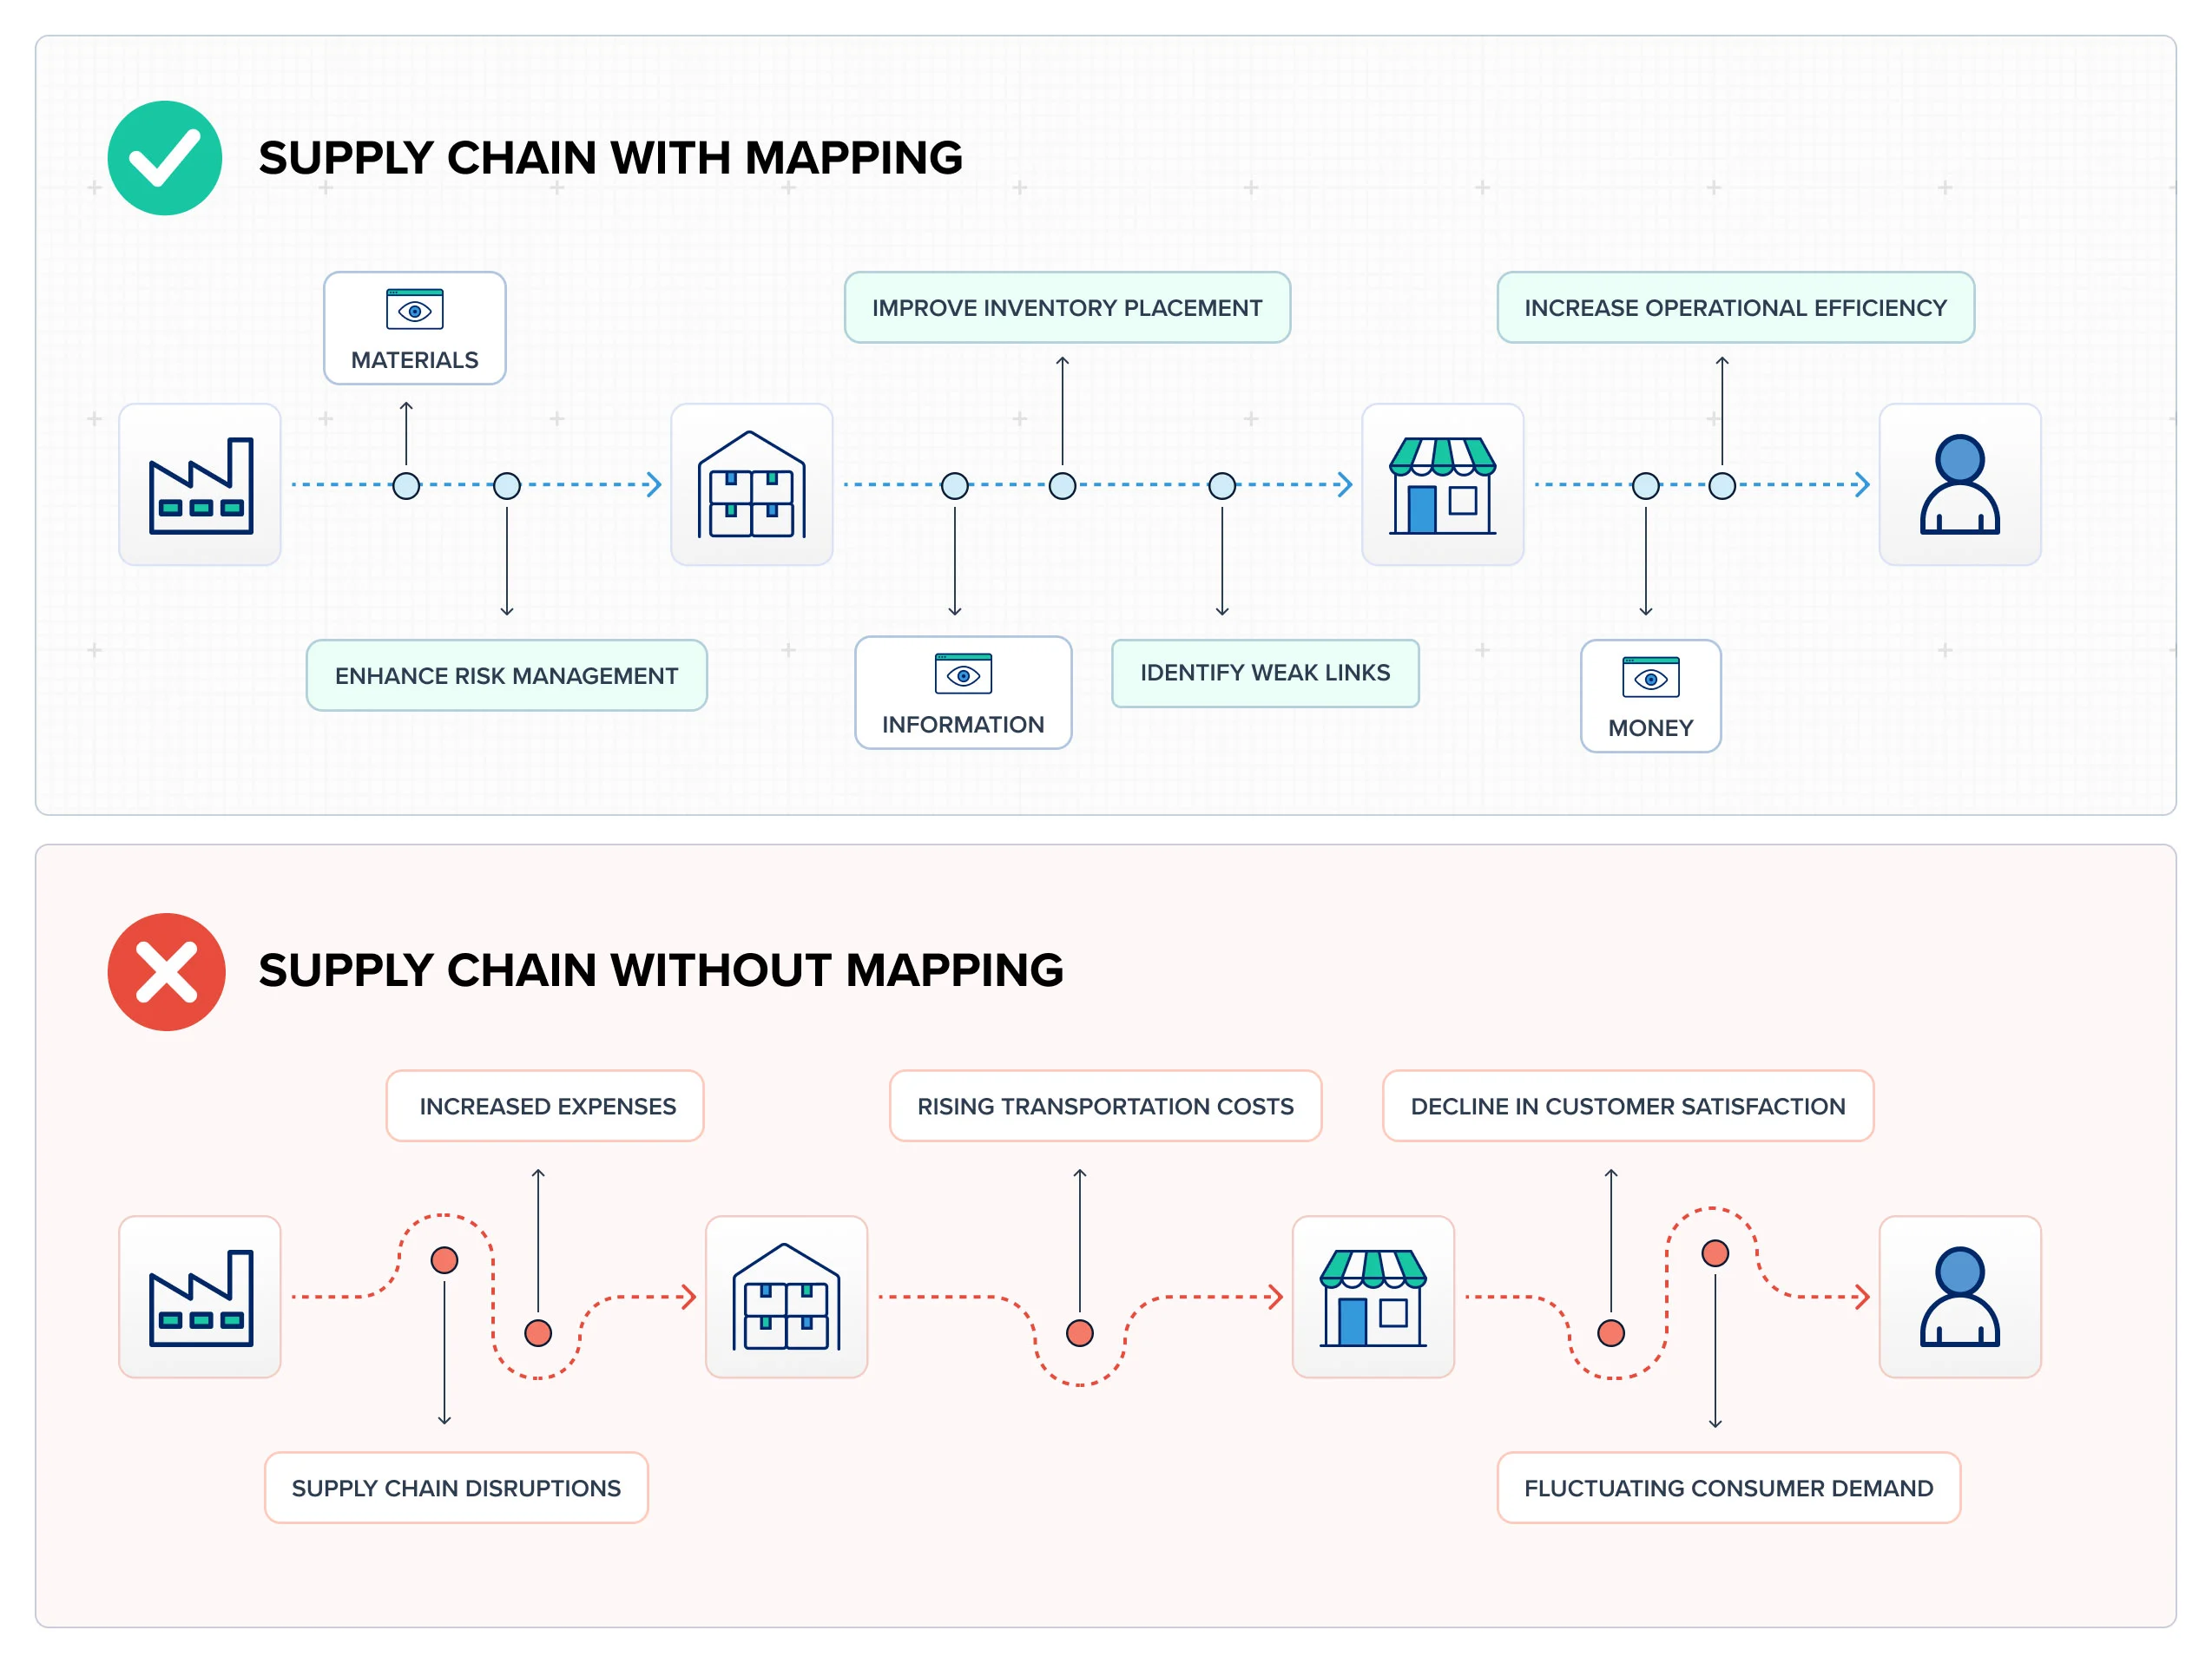
The most direct impact is on transportation logistics. Accurate, real-time mapping allows for dynamic route optimization. Algorithms can process data on road conditions, tolls, height and weight restrictions, weather, and even predicted traffic congestion. This means trucks take the fastest, safest, and most fuel-efficient path every single time.
Q: How significant are the savings?
A: The U.S. Department of Energy states that idle time from traffic congestion alone wastes nearly 7 billion gallons of diesel fuel annually for commercial trucks. Accurate mapping that mitigates this congestion directly attacks this massive cost center. It is not just about saving minutes. It is about saving gallons and tons of CO2 emissions.
## 2. Enhancing Warehouse and Yard Management Efficiency
Efficiency does not stop at the dock door. Inside the warehouse, accurate mapping of storage locations, picking paths, and equipment movement is crucial. This is often called “indoor mapping” or “warehouse digital twin” technology. By mapping every bin, rack, and workstation, warehouse management systems can generate the most efficient pick paths, reducing worker travel time by up to 50% in some documented cases.
Furthermore, in the yard, knowing the precise location of every trailer, its contents, and its status via a mapped yard management system slashes the time drivers spend searching for loads. This improves asset utilization and speeds up dock turnaround times.
## 3. Improving Demand Forecasting and Network Design
This is a more strategic influence. Accurate mapping of customer locations, demographic data, and sales patterns allows for vastly improved demand forecasting. Companies can visualize demand clusters and adjust inventory placement accordingly. Should you have three small regional warehouses or one massive centralized hub? Accurate mapping of your customer base and transportation corridors provides the data-driven answer.
For instance, mapping can reveal a concentration of high-value customers in an area poorly served by your current distribution network, prompting a strategic shift. This proactive network design, based on accurate spatial data, prevents costly reactive adjustments later.
## 4. Mitigating Risks and Enhancing Resilience
Modern supply chains face myriad risks: natural disasters, political unrest, port closures, and even localized strikes. Accurate mapping layered with risk data allows companies to visualize these threats in relation to their assets and routes. You can see if a primary supplier is in a flood zone or if a key shipping lane is near a conflict area.
This enables proactive contingency planning. Alternative suppliers and routes can be pre-qualified and mapped, drastically reducing response time during a disruption. In my experience consulting for retail clients, we used risk-mapped scenarios to reroute shipments during a major port strike, avoiding over $2M in potential lost sales. The map was our crisis command center.
## 5. Enabling Real-Time Visibility and Proactive Exception Management
Customers and managers now expect real-time, parcel-level visibility. Accurate mapping is the visual engine of this capability. It transforms a tracking number into a moving dot on a map, providing intuitive status updates. But its greater value is in exception management.
If a vehicle deviates from its planned route or is delayed in a known slow zone, the system can alert managers immediately. They can then proactively inform the customer or intervene to solve the issue before it escalates. This builds tremendous trust and reduces customer service inquiries.
## 6. Facilitating Better Supplier and Partner Collaboration
A shared, accurate map creates a single source of truth for all supply chain partners. Instead of exchanging spreadsheets and address lists, partners can collaborate on a unified platform. They can see the same estimated times of arrival, the same risk alerts, and the same inventory levels at mapped locations. This transparency reduces errors, aligns expectations, and fosters a more collaborative, efficient ecosystem.
## 7. Supporting Sustainability Initiatives and Reporting
Accurate mapping provides the verifiable data needed for sustainability reporting. Companies can precisely calculate and optimize route-related carbon emissions. They can map out the most efficient networks to minimize total miles traveled. This data is crucial for meeting ESG (Environmental, Social, and Governance) goals and reporting to stakeholders. It turns green ambitions into measurable, map-driven outcomes.
### Choosing the Right Mapping Technology: A Comparison
Not all mapping solutions are created equal. Here is a comparison of two common approaches:
| Feature | Basic Static Mapping (e.g., Standard GPS/Navigation) | Advanced Dynamic Supply Chain Mapping |
|---|---|---|
| DATA SOURCE | Primary road network data, updated infrequently. | Integrated multi-source data: real-time traffic, weather, telematics, IoT sensor data, proprietary logistics networks. |
| FUNCTIONALITY | Point A to Point B route finding. | Multi-stop optimization, territory planning, risk visualization, predictive analytics, and integration with TMS/WMS. |
| CUSTOMIZATION | Minimal. One-size-fits-all. | Highly customizable. Can model specific business rules, vehicle constraints, and delivery windows. |
| VISIBILITY | Limited to “where is it now?” on a simple map. | End-to-end supply chain visibility with predictive ETAs and exception alerts. |
| BEST FOR | Simple, local deliveries with no complex constraints. | Complex, global, or multi-modal supply chains requiring optimization and resilience. |
### A 5-Step Guide to Implementing Accurate Mapping
WARNING: A COMMON MISTAKE
Do not just buy a software license and expect miracles. Accurate mapping is a capability built on quality data and clear processes. The biggest pitfall is having a powerful mapping tool fed by inaccurate or siloed data. Garbage in, garbage out. Ensure your foundational data on facilities, partners, and products is clean first.
Follow this actionable guide to get started:
STEP 1: DEFINE YOUR KEY PAIN POINTS AND GOALS.
Are you aiming to cut fuel costs, improve on-time delivery, or reduce warehouse labor travel? Your goals will determine what you need to map and measure.
STEP 2: AUDIT AND CLEAN YOUR CORE LOCATION DATA.
This includes addresses for all suppliers, warehouses, customers, and cross-docks. Standardize formats, correct errors, and add GPS coordinates for critical nodes.
STEP 3: INTEGRATE DATA STREAMS.
Connect your mapping platform to live data sources. This includes your Transportation Management System (TMS), Warehouse Management System (WMS), telematics from vehicles, and real-time traffic feeds.
STEP 4: START WITH A PILOT PROJECT.
Choose one lane, one warehouse, or one product line. Implement the mapping solution, train the team, and measure the results against your pre-defined goals from Step 1.
STEP 5: ANALYZE, SCALE, AND ITERATE.
Review the pilot results. What worked? What data was missing? Use these insights to refine your approach before rolling out the solution across the entire organization.
### Your Supply Chain Mapping Readiness Checklist
To conclude, let us review the practical steps you can take. Ask yourself these questions:
HAVE WE IDENTIFIED OUR TOP 3 SUPPLY CHAIN INEFFICIENCIES THAT MAPPING COULD SOLVE?
HAVE WE ASSIGNED AN OWNER TO AUDIT AND CLEAN OUR MASTER LOCATION DATA?
HAVE WE BUDGETED FOR BOTH THE TECHNOLOGY AND THE INTERNAL CHANGE MANAGEMENT REQUIRED?
HAVE WE EVALUATED OUR CURRENT TECH STACK (TMS, WMS) FOR MAPPING INTEGRATION CAPABILITIES?
HAVE WE IDENTIFIED A SMALL, CONTROLLED PILOT PROJECT TO TEST THE VALUE?
HAVE WE DEFINED THE KEY METRICS (E.G., MILES SAVED, FUEL COSTS, ON-TIME IN-FULL RATE) TO MEASURE SUCCESS?
In summary, asking “in what ways does accurate mapping influence supply chain efficiency?” opens the door to a transformative capability. It is the difference between driving blind and navigating with a precision instrument. From the micro-level of a warehouse pick path to the macro-level of global network design, accurate mapping injects clarity, predictability, and intelligence into every link of the chain. The journey begins not with a complex software rollout, but with a simple commitment to seeing your supply chain for what it truly is: a dynamic, interconnected landscape waiting to be optimized.


